Tradesignal allows traders to apply a vast range of trading strategies, indicators, and views to enhance decision-making.
With access to a myriad of out-of-the-box modules, users can backtest scenarios on individual instruments or entire portfolios using historical data. Immediate performance reporting allows you to assess profitability, risk, and a host of metrics on your strategies before trading. In addition, all predefined strategy parameters can be modified and individual modules can be combined to create very powerful strategies – all through the drag and drop functionality.
Quick Visualisation
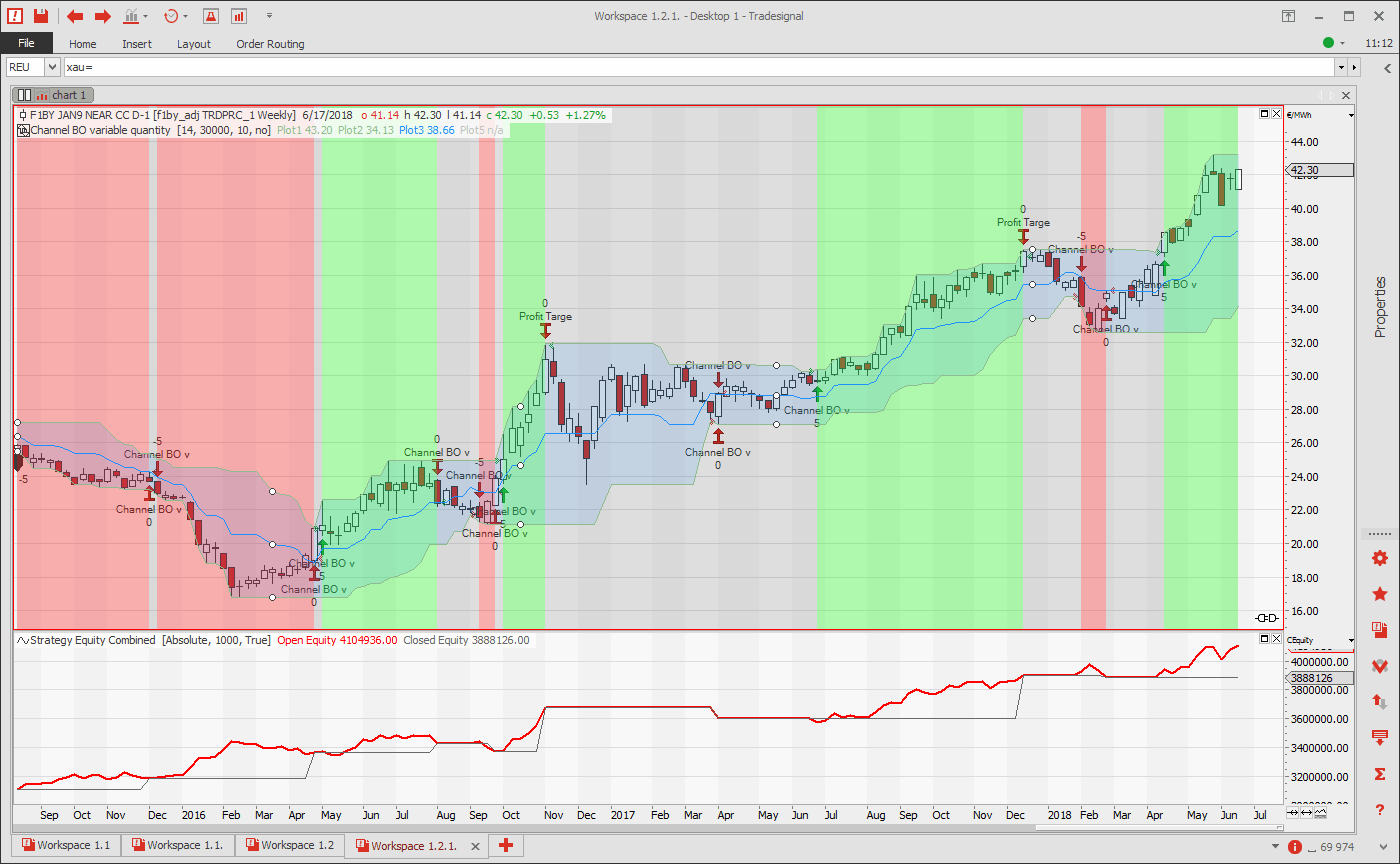
Breakout Strategy & Integrate Profit Target View
The breakout strategy allows you to view long or short positions based on the current trend. The chart also displays when your predefined profit is reached, thus when the position will then be closed.
Optimised Decisions
Quick & Effective Optimisation
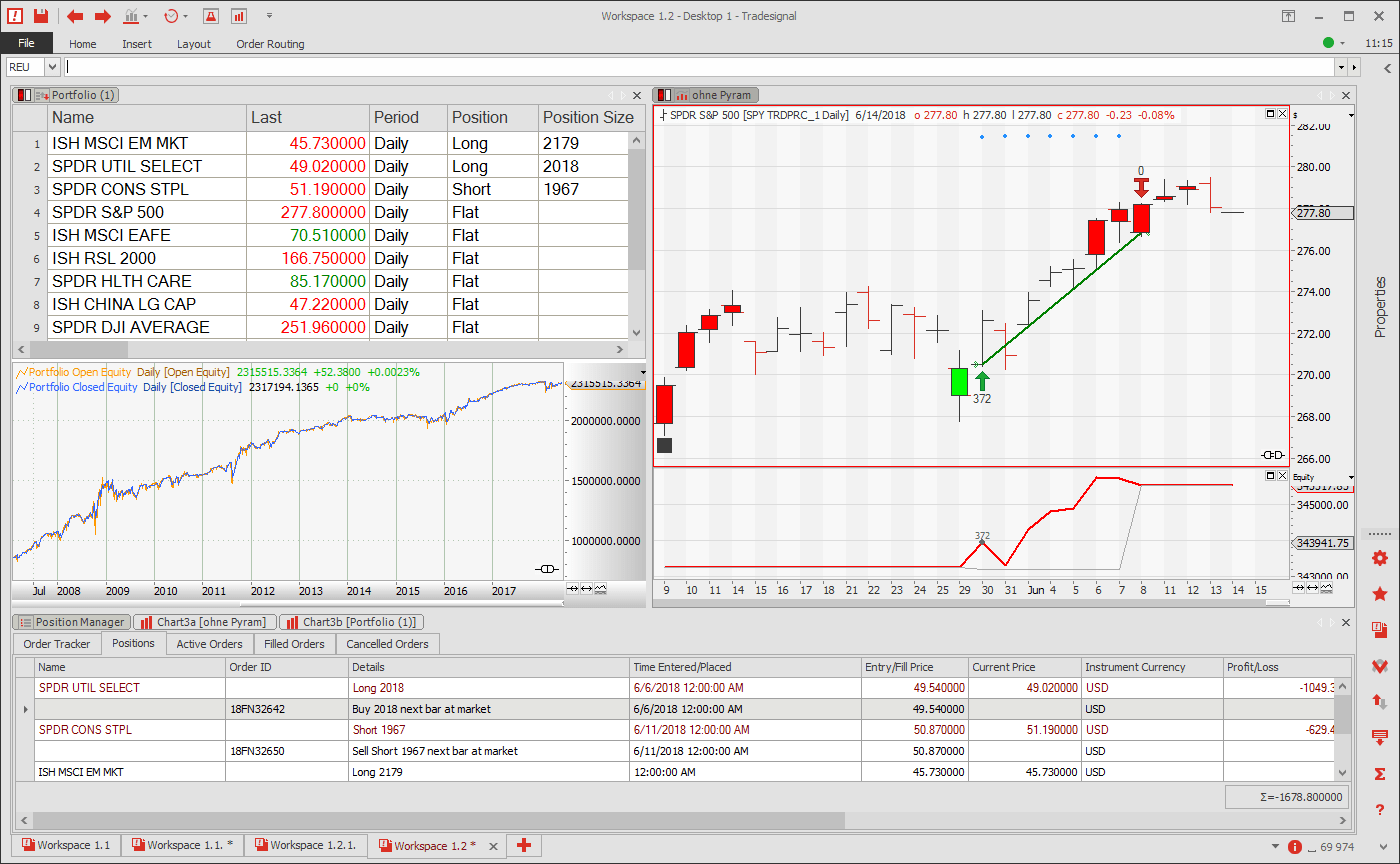
With Tradesignal you can apply trading strategies to portfolios with multiple views allowing easy visualisation of the equity curve, the portfolio position, and the P&L of each position – all in real-time.
Here is an example sector ETF portfolio (top left). The constituents can be added and subtracted at will and the portfolio strategy will automatically update. The equity curve of the entire portfolio, based on the outcome of the applied strategy, is shown below the list.
Optimizer Wizard
Systematic Portfolio Management
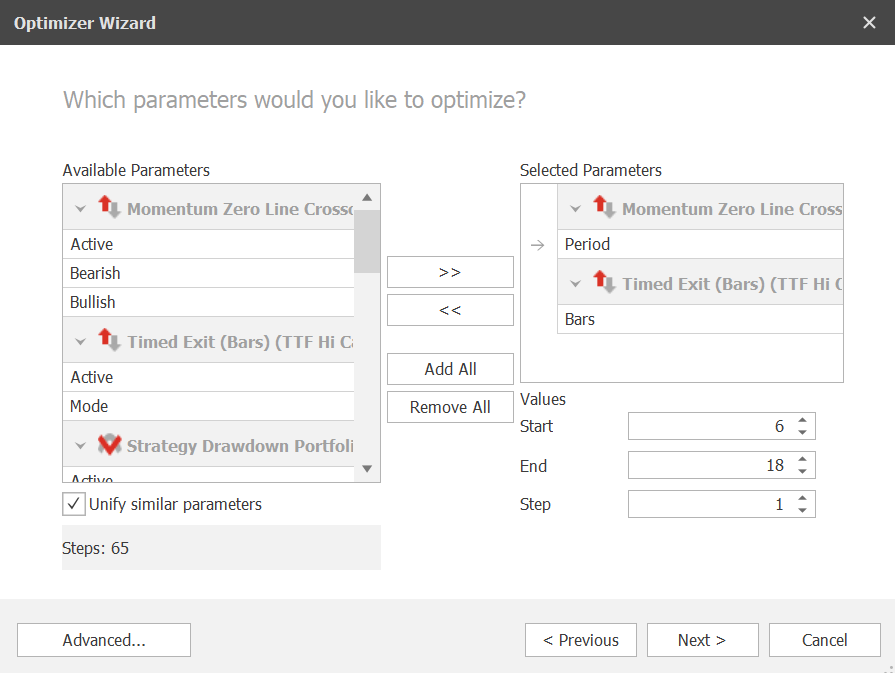
Take advantage of our wizard feature to optimise and backtest strategies. Optimize the appropriate stop size, a price target, the input period or any parameters required for the indicators. With 50+ configurable metrics including drawdown, Sharpe ratio, and profit factor you can perform a detailed assessment of the quality of your strategy.
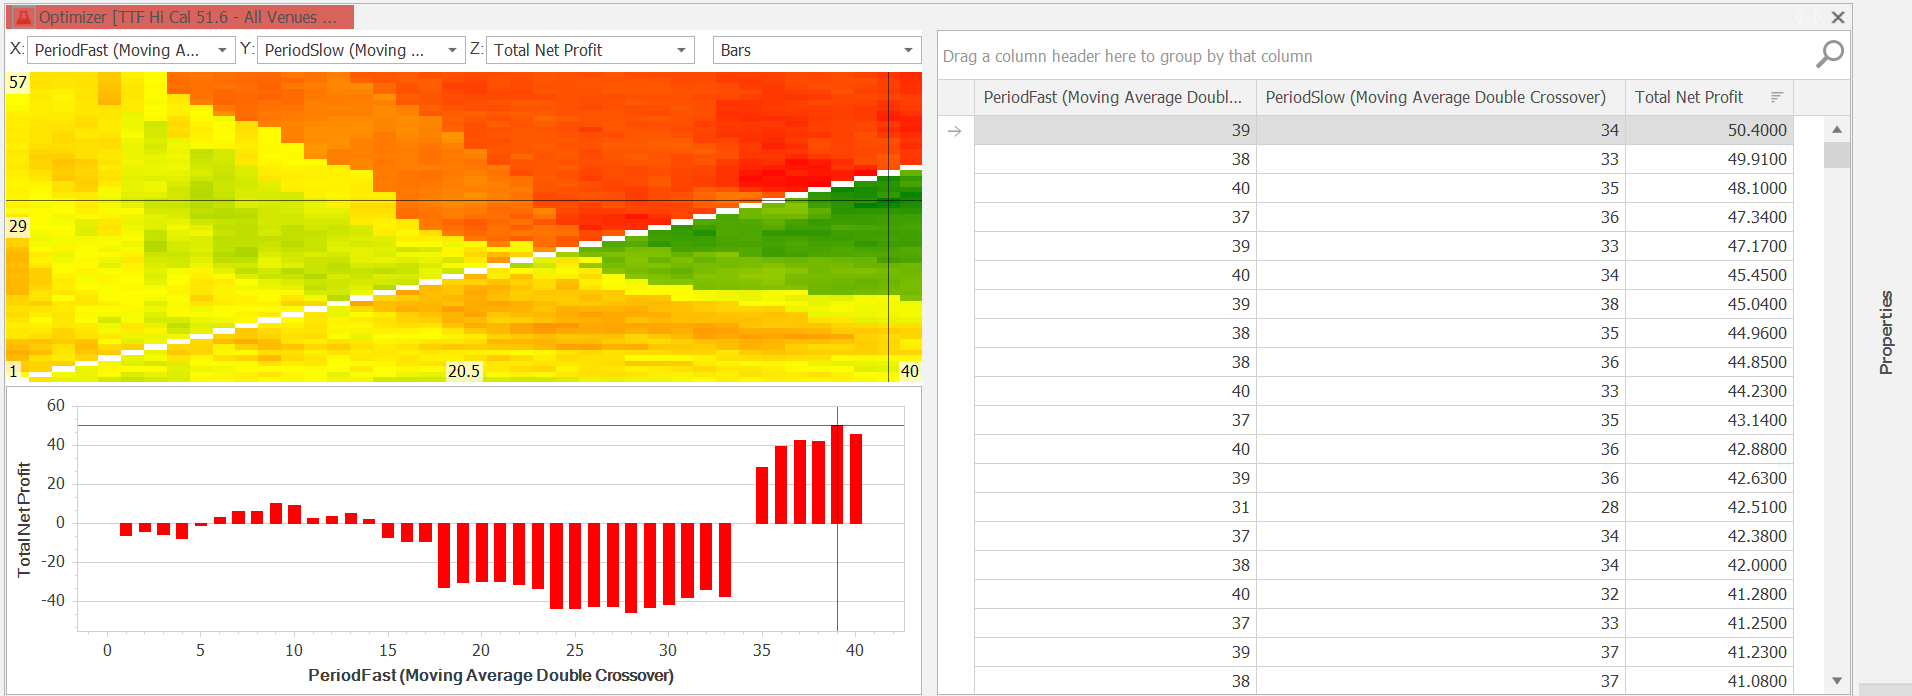
There are various types of optimisation available allowing large amounts of data to be analysed quickly and effectively. The example below shows a simple crossover strategy based on two moving averages with different period lengths. The optimiser then runs through all possible combinations of the parameters over a user-defined range.
Colour Heatmap
Testing Robustness
Optimisation results are displayed in an easy-to-read color heatmap providing an efficient and comprehensive overview to determine which combination of parameters generate positive or negative results. This will help in making informed decisions about the robustness of your trading strategy.
The Performance Report
The Metrics You Care About
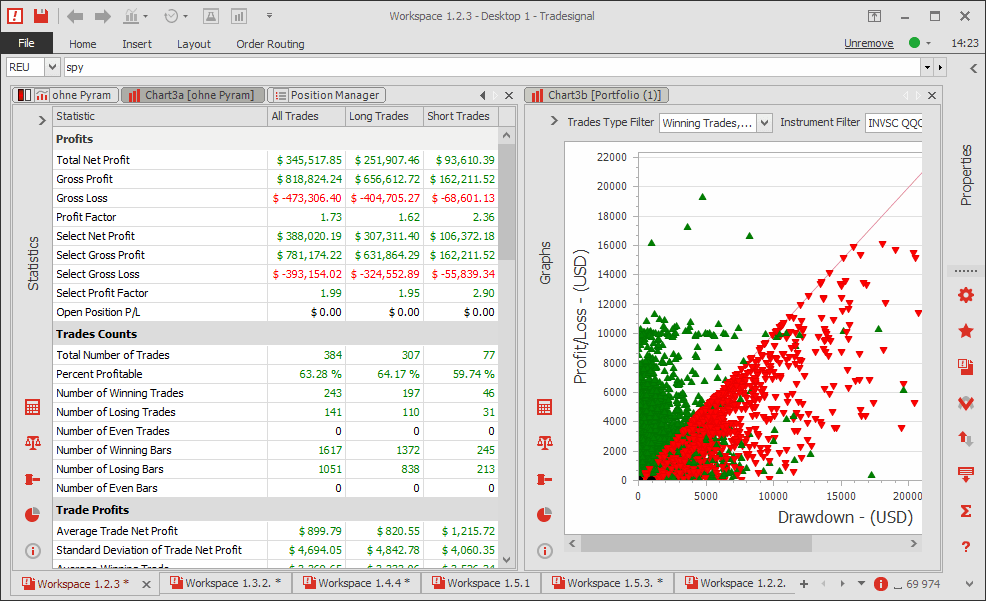
After completing the backtesting and optimisation process, you are provided with a detailed performance report which depicts a vast array of metrics relating to the optimised strategy, such as drawdown, return on account, and the Sharpe ratio. Additionally, you will be able to assess and adjust the effectiveness of your stops and price targets using the list of all trades.
This performance report shows the metrics on the left and the profit or loss in relation to the drawdown on the right.
